


Originally published: December 6, 2024
Updated: August 18, 2026
Reviewed by: Crystal Matocha, Event Reporting Specialist
Most virtual event reporting tracks everything and proves nothing. This post lays out a five-step framework for defining, measuring, and reporting ROI, built around the metrics that actually connect to a business outcome.
What is Virtual Event ROI?
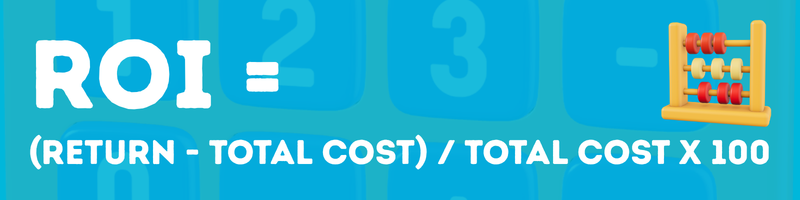
Virtual event ROI measures the value an event generated against what it cost to run. To measure it: define one goal before the event, track three to five metrics tied to that goal, total every cost involved, then compare the return against that cost. The formula is ROI = (Return - Total Cost) / Total Cost x 100. The math is simple, but defining what counts as "return" before is harder to define.
Remember: Registration and attendance assesses reach. ROI requires a separate calculation tied to your defined goal.
What Should You Know About Virtual Event ROI Before You Start Measuring It?
Virtual event ROI is the return you get from an event compared to what you spent to run it, but "return" isn't one interchangeable category.
- Closed revenue is realized return and drops straight into the ROI formula.
- Pipeline is potential return. Credit it under a defined attribution rule, then apply to a close rate or wait for deals to close before calling it ROI.
- Qualified leads, attendee engagement, and customer education are KPIs. Each needs a defensible dollar value before it counts as financial return.
Deciding on a goal works best as part of your broader event strategy. See the full Virtual Event Planning and Strategy Guide for that framework.
Why Does Measuring Virtual Event ROI Matter?
Calculating ROI gives your team three concrete advantages:
- It demonstrates value to stakeholders. Quantifiable data shows the actual business impact of an event.
- It sharpens future events. Event data shows what worked and what didn't, so the next event starts from evidence.
- It informs budget decisions. Comparing return across event formats and content types shows where resources produce the strongest outcomes.
How Do You Calculate Virtual Event ROI?
The basic formula is simple:
ROI = (Return - Total Cost) / Total Cost x 100
Fleshing out an accurate number involves five steps:
Step 1: Define the Goal
Start with the job the event supposed to do. Common goals include:
- Generate qualified leads
- Influence pipeline
- Educate customers
- Increase product adoption
- Build brand awareness
- Support account-based engagement
Secondary goals are fine, but one main goal keeps measurement clean.
Step 2: Choose the metrics tied to that goal
Not every event needs the same dashboard. Here's a practical way to map goals to metrics:
| Event Goal | Metrics to Track |
| Lead Generation | Registrations, attendance, form fills, demo requests, follow-up interest |
| Pipeline Influence | Target account attendance, engaged accounts, meetings booked, influenced opportunities |
| Customer Education |
Attendance, session completion, survey scores, post-event product usage |
| Brand Awareness | Registrations, live attendance, on-demand views, social engagement, survey recall |
| Engagement | Poll responses, chat activity, Q&A, survey completion, session watch time |
Step 3: Add up total cost of event
This is where teams often undercount. Be sure to include:
- Platform fees
- Speaker costs
- Promotion and paid media
- Internal labor
- Creative and production support
- Agency or contractor costs
- Post-event follow-up costs
Leaving out major costs makes your ROI numbers look better than reality.
Step 4: Measure the Return
For revenue-focused events, start with closed-won revenue, the only fully realized number on this list. Meetings that converted to opportunities are a strong leading indicator, though they remain pipeline until closed. Credit pipeline using an attribution rule, the defined criteria that decide when an event earns credit for influencing a deal, then track it the same way as any other pipeline figure until it closes.
For non-revenue events, use product adoption signals, retention indicators, or content engagement from target accounts, and assign each a defensible value before treating it as return. If you can't confirm a clean financial value, report performance through business outcomes instead of forcing a dollar figure.
Step 5: Compare return against cost
Be sure to use the right label for what you're measuring.
Simple example
Say your virtual event cost $12,000 to run. For that event, you generated:
- 40 qualified leads
- 8 sales meetings
- 3 opportunities worth $30,000 in influenced pipeline, credited under the attribution rule from Step 4: an engaged attendee tied to an opportunity opened within 60 days of the event.
That $30,000 is pipeline, not realized revenue, so it isn't ROI quite yet. Divide pipeline value by cost instead: $30,000 / $12,000 = a 2.5x pipeline-to-cost ratio. That's a legitimate early signal, distinct from a financial return.
If your team wants an interim dollar estimate before deals close, apply your historical close rate to the pipeline value. At a 20% close rate, $30,000 in pipeline carries an expected value of $6,000. Measured against the $12,000 cost, that's ($6,000 - $12,000) / $12,000 x 100 - -50% ROI, a materially different story than the 2.5x ratio alone suggests.
Calculate true ROI once revenue actually closes, using the same formula, (Return - Total Cost) / Total Cost x 100, with Return now meaning closed-won revenue attributable to the event under your attribution rule.
How Do You Follow Up After an Event to Protect Your ROI Numbers?
The 60-day attribution window from Step 4 only works if follow-up happens fast enough to fall inside it. A lead that sits untouched for three weeks isn't likely to convert within that window, whatever the attribution rule allows for on paper.
Prioritize follow-up by engagement level: live attendance, questions asked, resources downloaded. Route qualified leads to sales within 24 to 48 hours, with attendance and engagement data synced to CRM the same day.
For leads needing more nurture time, tie the sequence to the content they engaged with to keep the event's influence alive within the attribution window.
How Do You Measure ROI Across a Virtual Event Marketing Series?
The same five-step framework applies across a series, with one adjustment: define the goal at the series level as opposed to the per-event level. That ensures individual sessions aren't competing against each other for credit. Track core metrics for each event individually, then roll them up against the series' total cost and total return.
This matters most for account-based programs. A series aimed at 50 target accounts should report which accounts engaged across multiple sessions, not just which single event performed best.
Which Metrics Matter Most
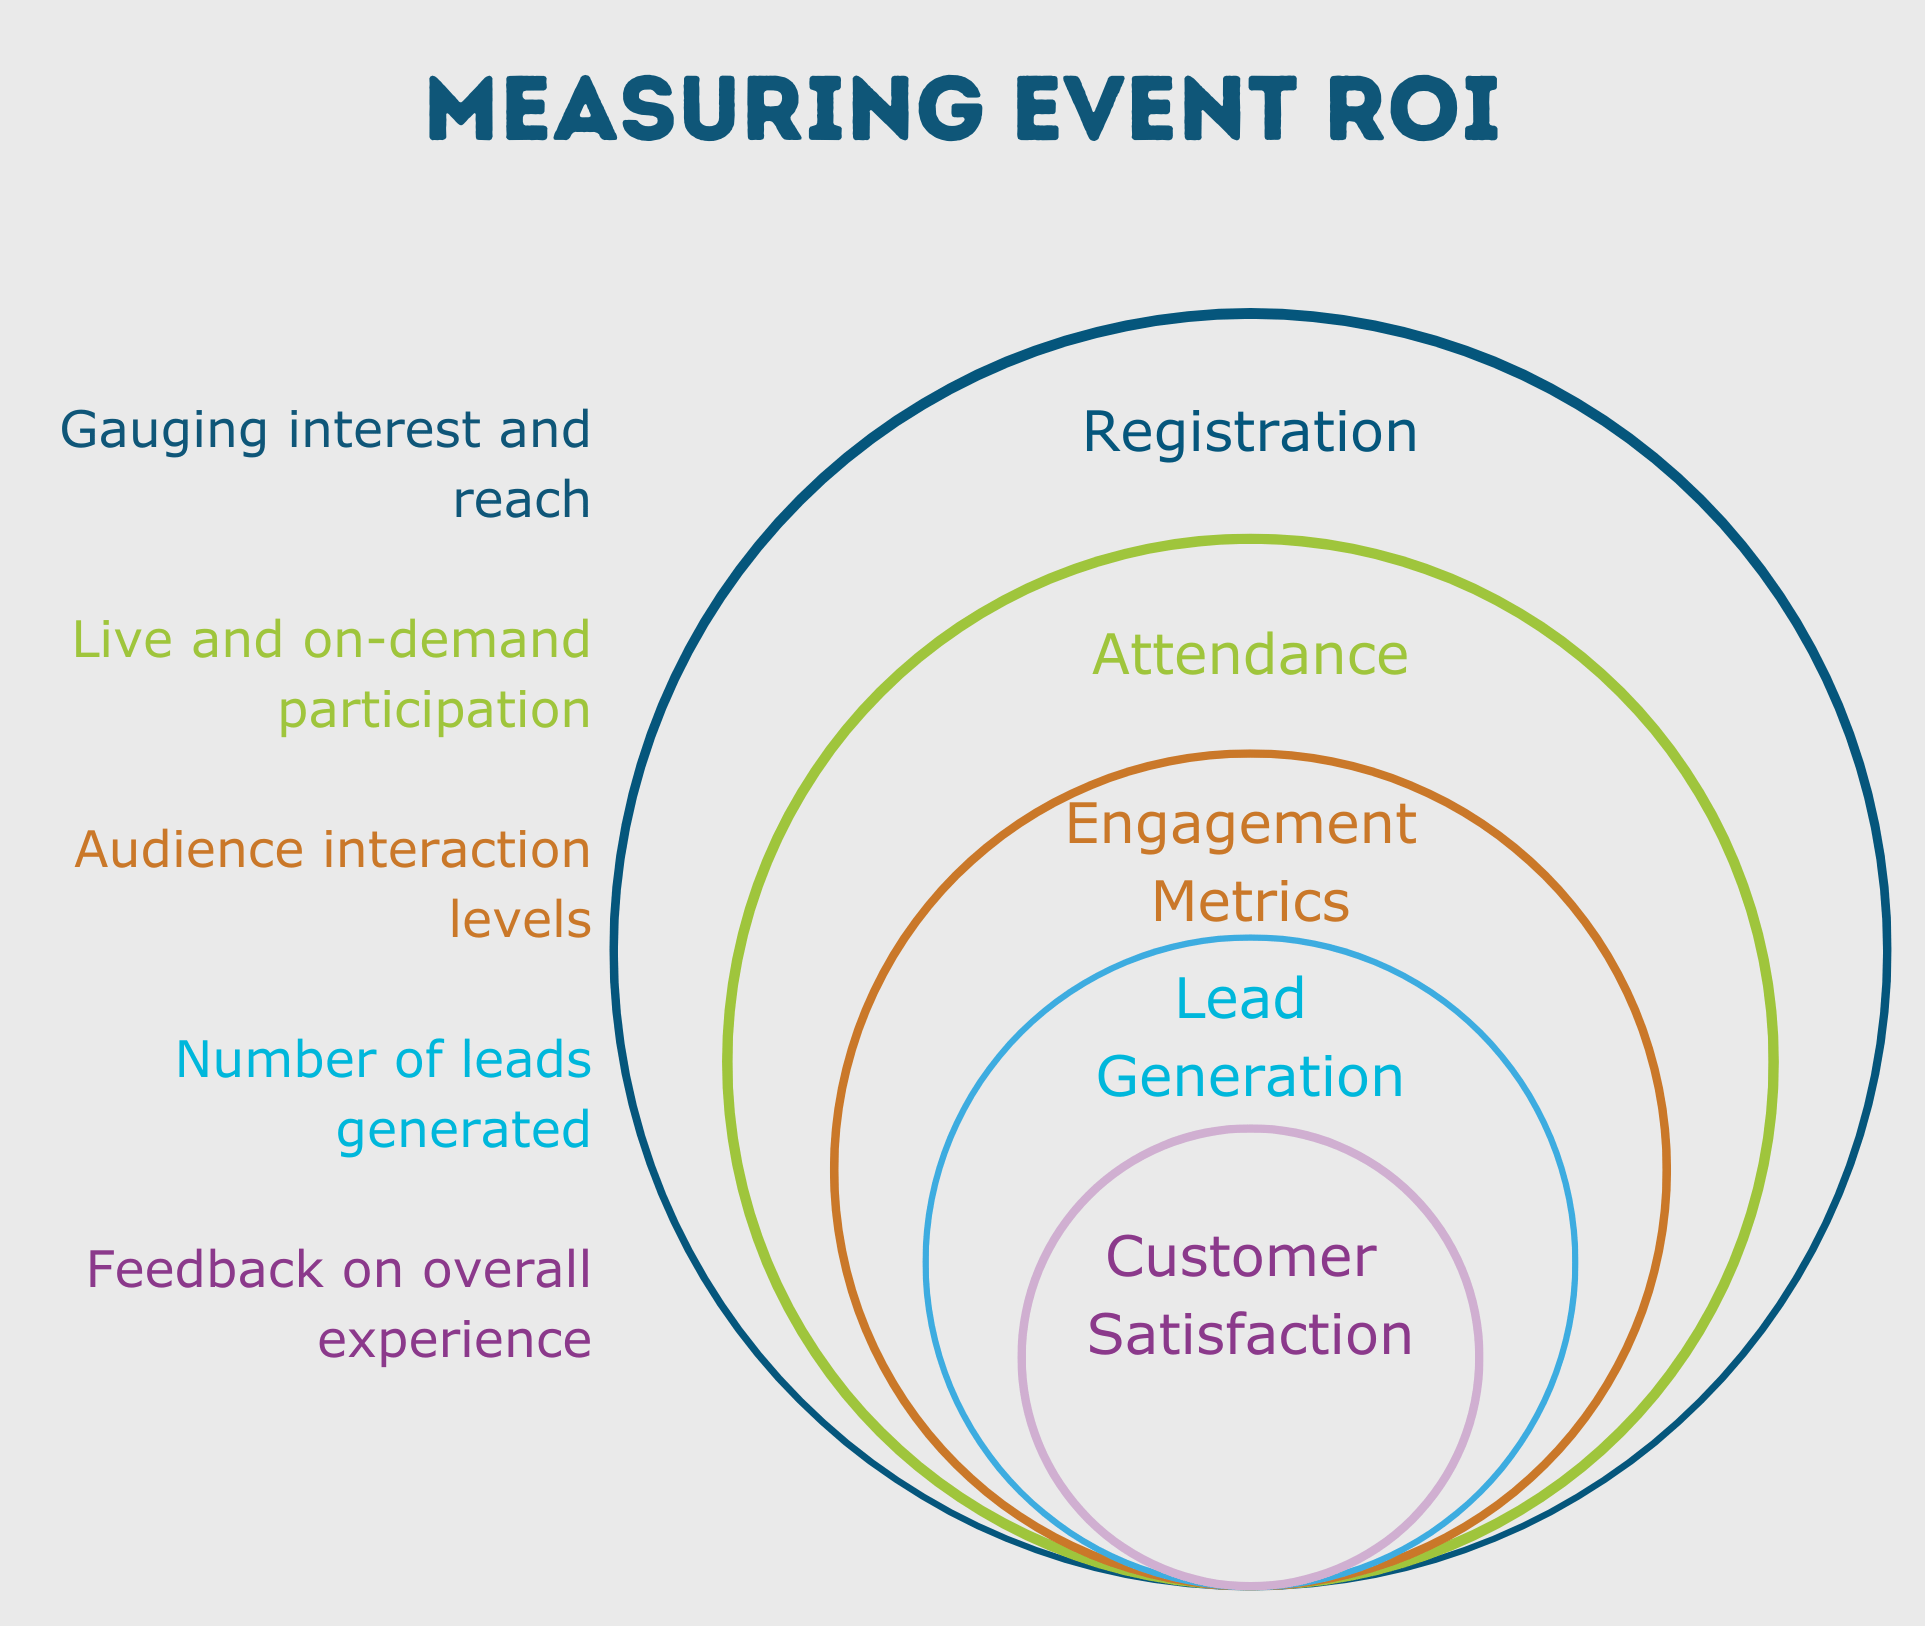
Five metric groups cover most ROI reporting needs.
1. Registration
Shows whether the topic, positioning, and promotion got attention. A useful top-of-funnel signal, but incomplete on its own.
Track:
- Total registrations
- Source
- Campaign to sign-up conversion
- Audience fit
2. Attendance
Shows who actually showed up, live and on-demand. On-demand performance often carries real value even past the live session.
Track:
- Live attendance rate
- On-demand views
- Session drop-off points
- Repeat attendance across events
3. Engagement
Where event quality starts to show up in your data. Useful engagement signals include:
- Poll responses
- Q&A submissions
- Chat activity
- Survey completion
- Time in session
A high registration count paired with weak engagement usually signals a content problem; the promotion already did its job.
4. Lead Generation and Conversion
The metrics that matter most if the event supports revenue.
Look at:
- Form submissions
- Content downloads
- Demo requests
- Follow-up opt-ins
- Meetings booked
- Opportunities influenced
5. Customer Feedback
Surveys add context numbers can't. Ask questions such as:
- Was the content useful?
- Was the topic relevant?
- Did attendees leave with clear next steps?
- Would they attend again?
How Do You Segment ROI Reporting for More Useful Insight?
Raw totals hide the patterns that make reporting useful to other teams.
By Audience Segment
This is particularly useful for when you run events for different industries, customer types, or product lines. Segmentation helps you see which groups respond best to which topics.
By Company
Critical for account-based programs. Look at:
- Which target accounts registered
- Who attended from each account
- How deeply they engaged
- Whether follow-up happened
By Persona
When you segment by role, you're able to see whether the content matched the intended buyer or stakeholder. A session that performs well with practitioners may underperform with senior decision-makers.
By Engagement Level
"Bucket" registrants into tiers:
- Registered only
- Attended live
- Attended and engaged
- Attended, engaged, and converted
This makes follow-up sharper and reporting more honest.
By Geography
Region matters more than you might expect. It affects:
- Live attendance
- On-demand behavior
- Timing preferences
- Promotion performance
A region that consistently watches on-demand usually signals a scheduling issue, which is worth investigating before content gets blamed.
How Do You Use Benchmarking to Add Context?
A single event's numbers are hard to judge on their own, so benchmarking gives you something to compare against, such as:
- Previous events
- Quarterly averages
- Program-wide averages
- Audience-specific baselines
Useful benchmarks include:
- Average attendance rate
- Live vs on-demand split
- Average engagement rate
- Survey completion rate
- Conversion follow-up rate
Tracking these over time surfaces real trends instead of reactions to a single, isolated event.
How Do You Keep Post-Event Surveys Useful?
Post-event surveys gives you the kind of direct feedback that you can't get from analytics alone. They work best when they're short and specific to the event's goals.
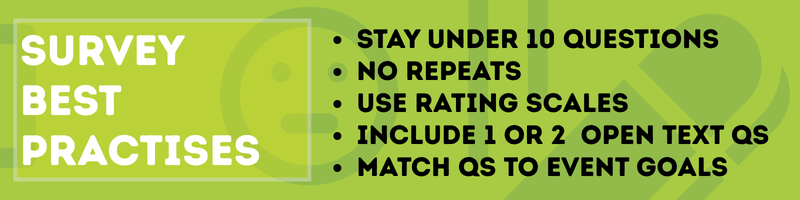
Survey Best Practices
- Keep it under 10 questions
- Skip questions you can already answer from registration or platform data
- Use rating scales for faster analysis
- Add one or two open-text questions for nuance
- Match every question to the event's defined goal
For a lead generation webinar, you might ask:
- How useful was this session?
- Would you like a follow-up conversation?
- Which topic would you like next?
For a customer education event, you might ask:
- Did this session answer your question?
- How confident do you feel using this feature now?
- What still needs clarification?
How Do You Present ROI to Stakeholders?
Good reporting shows what happened and why it matters. Keep the report structured around these six elements.
What to Include in a Stakeholder Report
- Event goal
- Total cost
- Core performance metrics
- Return measure used
- ROI or outcome summary
- Recommended next action
Example Stakeholder Summary
Goal: Generate qualified pipeline
Cost: $12,000
Results: 850 registrations, 420 live attendees, 190 engaged attendees,8 meetings booked, $30,000 influenced pipeline.
Takeaway: Topic and audience fit were strong, and conversion from engagement to meeting held up well. Recommendation: Repeat this format with tighter targeting in EMEA given the region's high on-demand activity.
A short, conclusion-driven summary like this is easier to act on than a dashboard with no takeaway attached.
How Often Should You Review Virtual Event Metrics?
Different metrics become useful at different points, so your timing matters.
Right After the Event
Review:
- Attendance
- Engagement
- Survey responses
- Immediate follow-up signals
Monthly
Review:
- Topic performance
- Registration trends
- Speaker performance
- Audience growth patterns
Quarterly
Review:
- Segment performance
- Content trends
- Audience shifts
- Sales and customer impact
- Which event types delivered the strongest return
Where Reporting Gets Hard, and Where It Gets Easier
Reporting gets harder when attendance, engagement, and follow-up data sit in separate systems that don't talk to each other. EventBuilder connects event and engagement data directly to Microsoft Power BI, so ROI reporting draws from one consolidated source instead of being assembled by hand across platforms.
Measuring Virtual Event ROI FAQ:
What should I know about virtual event ROI before I start measuring it?
Define what counts as "return" before the event happens. Registration and attendance measure reach; value is a separate, deliberate measurement. Pick one primary goal, track three to five metrics tied to that goal, and total every cost involved before calculating ROI.
How do you measure ROI across a virtual event marketing series?
Define the goal at the series level rather than per event, then roll results up against total series cost and return. For account-based series, track engagement across multiple sessions per account rather than relying on single-event performance alone.
How do you measure ROI for events without direct revenue?
Use goal-based outcomes, such as qualified leads, target account engagement, retention signals, or product education, tied to a consistent attribution rule that defines what counts as caused by the event. Without that rule, soft outcomes are just as easy to over-credit as pipeline. If you can't assign a defensible dollar value, report the outcome directly instead of forcing it into the ROI formula.
Is attendance enough to prove ROI?
No. Attendance shows reach on its own. Connect attendance to engagement, conversion, or another outcome tied to the event's goal before calling it ROI.
How many metric should I track for virtual event ROI?
Start small: one goal, three to five core metrics, and one clear return measure. That's usually enough to build a reliable view of performance without drowning in data.
What's the Bottom Line on Measuring Virtual Event ROI?
Virtual event ROI stops being complicated once the goal is defined before the event starts. Pick one primary outcome, track three to five metrics tied to it, total the real cost, and compare that against the return. The formula stays identical whether you're reporting on a single webinar or a twelve-event marketing series aimed at fifty target accounts. What changes is the discipline behind it: defining return early, county every cost honestly, and building reports stakeholders can act on instead of a dashboard nobody opens twice.
See how EventBuilder's reporting and Power BI integration turn event data into stakeholder-ready ROI reports designed to your exact event goals. Reach out and get started today.

Disclaimer: This article was created with some help from AI, but thoroughly edited, revised, reviewed, and fact-checked by a living, breathing, coffee-drinking human writer. Any and all em-dashes were strictly human-created.
Virtual Event Production Guide for Modern Event Teams
Virtual Event Management Roles and Responsibilities
No Comments Yet
Let us know what you think