


Your Microsoft Teams-based webinar or Town Hall ran smoothly, from registration to the final Q&A, and now your stakeholders want to know whether it was worth it. "We had 600 registrants" won't satisfy sales, customer success, or leadership because they want proof the event moved a business outcome. This guide covers every report Teams Webinars and Town Halls provide in 2026, where to find each one, and how to turn that data into an ROI case. It's part of our larger guide to running large events on Microsoft Teams.
Who this guide is for: Event managers, marketers, trainers, customer success and partner program owners, and internal communications teams who run Microsoft Teams Webinars and Town Halls and report results to leadership.
What Reports Do Microsoft Teams Webinars and Town Halls Provide?
Microsoft Teams Webinars provide registration, attendance, and Q&A reports, plus exportable poll results and the recording. Town Halls add real-time event insights during the broadcast, a post-event attendance report, and a Q&A report. Insights stay available for 28 days, and Q&A exports cover only the previous 28 days. To measure ROI, export those reports within the 28-day window and join them to your CRM, LMS, or survey data, and compare the outcome against the total cost.
What Microsoft Teams Webinars and Town Halls Actually Report
Many organizers are understandably fuzzy on what data Microsoft Teams actually provides and how far it goes toward answering business questions. At a high level, Microsoft Teams webinar reporting is strong at "who joined and when." It is less focused on what content worked, who showed intent, or where to focus follow-up.
Teams Webinar Reporting: What You Get Out of the Box
Microsoft Teams Webinars include several built-in reports that help you confirm basic participation and capture some interaction data. Attendance reports are a foundational event feature, so core webinar reporting works on every Teams license and no longer requires Teams Premium.
1. Registration Report
The registration report usually includes:
- Registrant name
- Email address
- Registration date and time
- Responses to custom registration questions (where supported and configured)
The Reports view also shows how many people viewed your registration page and how many canceled. This report is useful for:
- Top-of-funnel metrics (registration vs attendance)
- Basic segmentation (e.g., by role, region, or product interest if you use custom fields)
2. Attendance Report
The webinar attendance report usually captures:
- Attendee name (or "Guest" or anonymous if not authenticated)
- Join time and leave time
- Total time in the webinar
- Re-join instances (which can appear as multiple line items per person)
What this does well:
Helps you answer questions such as "Who actually showed up?" and "How long did they stay connected?"
Nuance alert! Because Teams logs each join/leave as a separate row, raw counts can be misleading. To get accurate unique attendance and engagement duration, you need to aggregate multiple joins per person.
Your admin's meeting policy matters, too. By default, attendees can opt out of being identified, and admins can limit reports to who attended, without join and leave times. Confirm both settings before you promise attendee-level results, especially for secure, compliant Town Halls.
3. Polls and Q&A (Engagement-Related Reports)
Depending on how your tenant is configured, you'll have access to engagement-related data through:
- Polls Report with responses to live polls
- Q&A Export listing questions, answers, timestamps, identities (when not anonymous), and reactions
These are powerful for understanding what people cared enough to react or ask about.
Things to keep in mind:
- Poll and Q&A data live in separate files
- There's no built-in view that tells you, "this person answered these polls, asked these questions, and downloaded these resources."
- Poll responses carry names only when you turn on respondent names before launching the poll
- The Q&A export is only available for 28 days post-event
- Neither export scores sentiment, so you or your tools need to interpret the themes.
Our Teams Webinar engagement guide covers how to run polls and Q&A that produce useful data.
4. Recording and Transcript
Post-event, you'll also have access to:
- Recording file
- Transcript (where turned on)
These are invaluable for:
- On-demand viewing
- Creating follow-up content, such as clips, highlight reels, and FAQs
- Presenter review and coaching
However, these aren't analytics. They don't tell you who watched which segment, or where engagement dropped off without additional tools.
How to Download Teams Webinar Reports (Organizer View)
- Open Microsoft Teams and go to Calendar.
- Select the webinar you hosted, then View event > Manage event.
- Open the Attendance tab and select Download to export the CSV.
- Open Reports for registration details.
- From Reports, select Download > Q&A Report.
- For polls, open the Polls tab and select Export results from the View results menu.
These reports help confirm participation, but they leave out content interaction, sentiment signals, and detailed behavior that sales and marketing teams typically request. Only the organizer can open webinar reports today (Microsoft lists co-organizer access as unavailable ), so pull every export before you hand the event off.
What Reports Do Teams Town Halls Provide?
Teams Town Halls are built for large, one-to-many broadcast-style events. Think all-hands, big announcements, or executive briefings. Town Halls follow the same license-based limits as Webinars. Microsoft 365 Business and Frontline plans support up to 1,000 registered attendees, Enterprise licenses raise that to 3,000, and both allow up 10,000 without registration. Attendee Capacity Packs extend events to 100,000 large-scale Teams events. Teams Live Events closed to new scheduling on June 30, 2026, and already-scheduled Live Events run only until February 28, 2027. Town Halls replace them, so that's where your broadcast reporting lives now. Typical Town Hall reports include:
1. Real-Time Event Insights
Real-time insights are an advanced event feature (Teams Enterprise) for Town Halls of up to 3,000 attendees. During the broadcast, organizers and co-organizers open Manage event > Reports > View event insights to see:
- Total viewers and peak concurrency
- Median session duration
- Top countries or regions
- Joining and leaving trends across the broadcast
- Viewing quality, rated good below 2.5% rebuffering and poor above it
- Breakdowns by attendee type, app, operating system, or public IP
Event Summary view of a Teams Town Hall
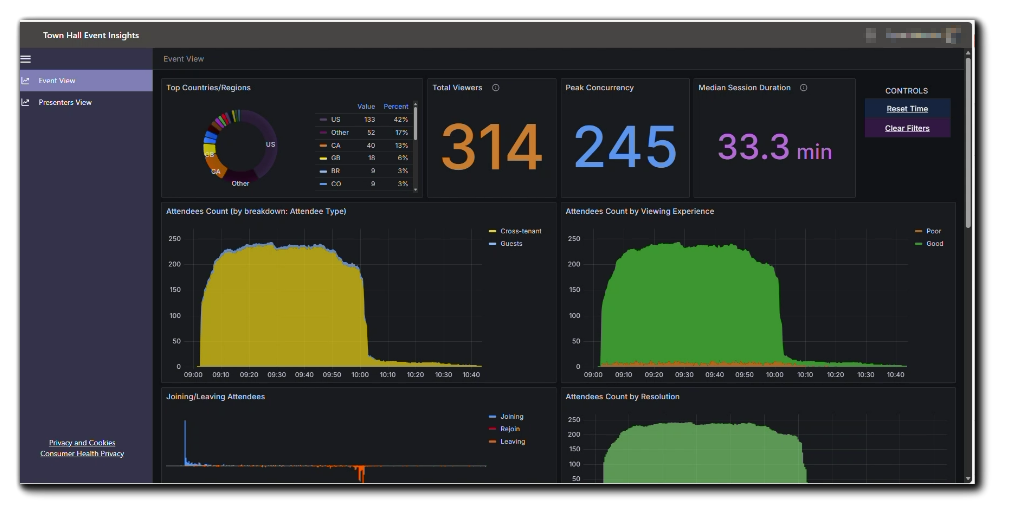
Each chart exports to CSV and stays available for up to 28 days after the Town Hall starts. Presenter analytics rates each presenter's broadcast quality green, yellow, or red, but presenters currently need a Teams Premium license to appear in it, a requirement Microsoft says it will remove. Teams Premium licenses bought before April 1, 2026 keep insights for events up to 100,000 attendees until they expire.
2. Teams Town Hall Attendance Report
You typically get:
- Attendee name or anonymous identifier
- Join and leave times
- Viewing duration
This helps answer questions such as:
- Overall audience size
- Peak concurrency
- Session drop-off trends
Every licensed organizer can download this report, since Microsoft lists attendance reports as a foundational event feature. It also shows total attendee count, event duration, and average attendance time.
3. Q&A Report
The Town Hall Q&A report includes:
- Published questions
- Responses from presenters or moderators
- Timestamps
- Moderation details (for example, dismissed or private responses)
This is useful for understanding theme-level interest and concerns, but not for scoring individual attendees or accounts.
4. Organizer Summary & Recording
Organizers also see:
- A high-level summary that may include audience size and presenter activity
- The Town Hall recording, typically stored in SharePoint/OneDrive, for on-demand access
For on-demand reach, Teams admins can pull a Recording Views count per event from the Teams events usage report. One recording reused across several simulive runs reports as one aggregate number.
How to Download Town Hall Reports
- During the event, open Manage event > Reports > View event insights and export any chart you need as CSV.
- After the event, open the past Town Hall's details from your Teams calendar.
- Select Reports, choose the event date and time, and select Download for the attendance report.
- From Manage event > Reports > select Download > Q&A report.
Download everything within 28 days. Insights and Q&A exports age out after that.
Who Can Open Each Teams Event Report (Verified October 2026)
|
Report |
Event types |
Who can open it |
Limits |
|---|---|---|---|
|
Registration report |
Webinars |
Organizer |
Page views, registrations, cancellations |
|
Attendance report |
Webinars, Town Halls |
Organizer |
Subject to your admin's attendance policy |
|
Q&A report |
Webinars, Town Halls |
Webinars: Organizer; Town Halls: Organizer, co-organizers |
CSV, previous 28 days only |
|
Poll results |
Webinars |
Organizer |
Names only when recorded before launch |
|
Real-time event insights |
Town Halls |
Organizer, co-organizers, IT admins with the shared link |
Up to 28 days; events up to 3,000 attendees |
|
Teams events usage report |
Webinars, Town Halls |
Teams admins |
Recording Views per event; 90-day range |
Reporting is one factor in choosing a format. Our guide to Teams meeting types compares Webinars and Town Halls side by side.
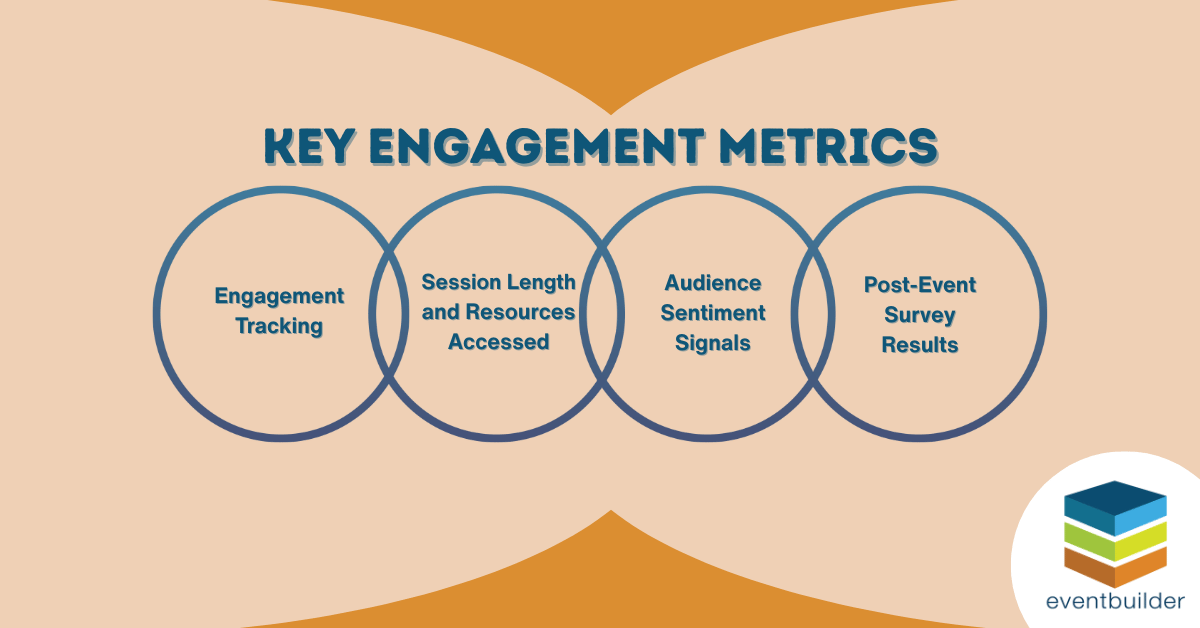
Key Engagement Metrics
A stronger reporting model focuses on behaviors rather than attendance logs. Metrics that support decision-making include:
- Engagement Tracking - Indicators that include polls answered, chat participation, Q&A activity, resource downloads, and session duration.
- Measure it: poll participation (unique respondents / unique attendees) and Q&A participation (unique people who posted / unique attendees) from the poll export and Q&A report.
- Session Length and Resources Accessed - Details on how long attendees viewed specific sessions, both live and on-demand, along with which materials they accessed.
- Measure it: average time in session (total attendee minutes / unique attendees) from the attendance report, the drop-off minute from the Town Hall join and leave chart, and Recording Views for on-demand reach.
- Audience Sentiment Signals - Themes and patterns in Q&A, along with keywords that indicate questions, concerns, or interest areas.
- Measure it: tag Q&A posts by topic, then rank themes by reaction count.
- Post-Event Survey Results - Actions that suggest higher intent, such as multiple (unique) event recording views, survey responses, or downloaded resources.
- Measure it: start with a show rate (unique attendees / registrants), then add survey responses, resource clicks, and demo or course sign-ups from your CRM, LMS, or survey tool.
Metrics like these help organizers make informed decisions without relying on assumptions. Count unique participants, though. A Q&A with 200 questions from 15 people tells a different story than 200 questions from 150 people, and Teams totals hide the difference.
How Do You Measure ROI From a Corporate Town Hall?
Measure a Town Hall against the one outcome it exists to move, then show the Teams data that connects attendance to that outcome. That is how "we had 600 registrants" becomes an answer leadership accepts. For internal Town Halls that outcome is usually reach and understanding; for customer and partner events, it is pipeline, certification, or product adoption.
- Name the outcome before the event. Policy awareness, change adoption, training completion, or qualified pipeline. One outcome per event keeps the report honest.
- Pick three or four signals from the metrics above that tie to it. A change-management Town Hall might track live reach, on-demand views, question themes, and a pulse-survey score. Poll results count here when respondent names are recorded, so you can match answers to registrants.
- Join the exports to the system that holds the outcome. Match Teams data to your CRM, LMS, or HR survey tool by email, and report anonymous or opted-out attendees as a separate count.
- Total the cost. Include production hours, presenter prep time, Attendee Capacity Packs or Enterprise licenses, and partner fees.
- Report the result against cost and against your last comparable event. Use ROI = (value of outcome - total cost) / total cost x 100 where the outcome has a dollar value. Where it does not, report the change in reach and comprehension instead.
For the full ROI method, see our guide to measuring virtual event ROI.
How EventBuilder Expands Microsoft Teams Reporting
EventBuilder's event management services, powered by our own software, extend Teams for organizations that use it for webinars, onboarding, training, customer education, and partner communication. EventBuilder has delivered more than 75,000 of Microsoft's own events and provides customized reporting for:
- Registrant Activity
- Per-registrant demographics
- Attendance flag (attended / did not attend)
- Individual answers to surveys
- Attendance Activity
- Detailed connection data, including time and duration for each attendee
- Recording View Activity
- On-demand viewing behavior for recorded events, with similar detail to live attendance
- Messages Activity (for streaming events)
- Full log of questions and messages throughout the event
On top of that, EventBuilder provides post-event survey data, portal-level reporting, and Power BI connectors to unify data across events. Attendee data stays under our ISO 27001 information security and ISO 27701 privacy management certifications.
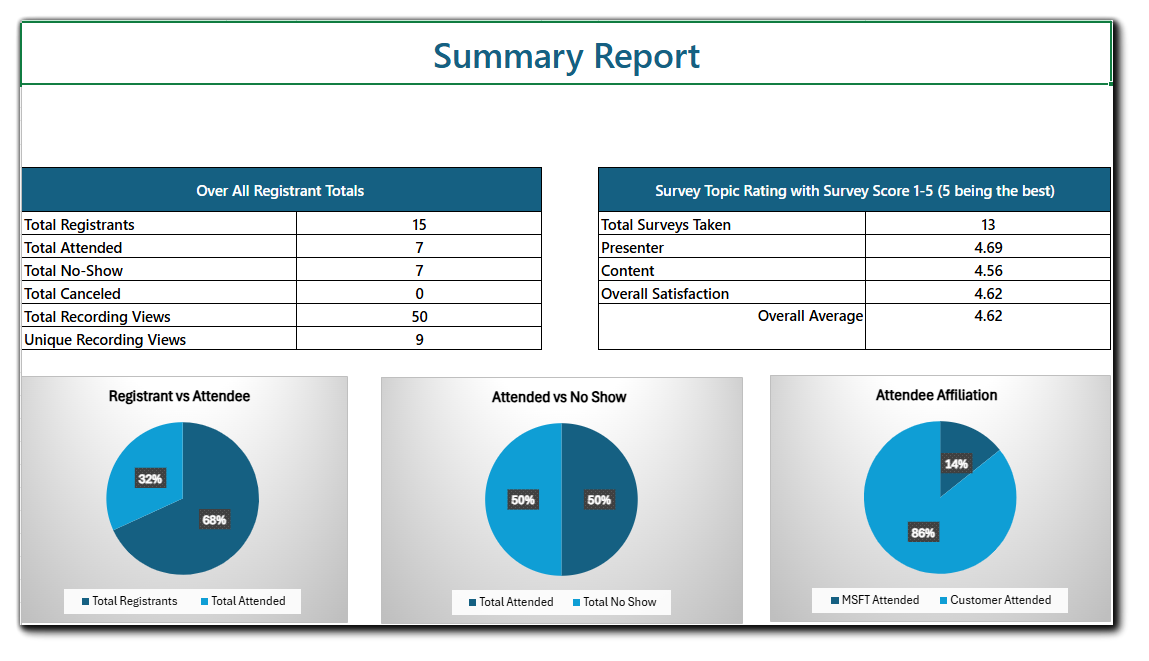 EventBuilder custom summary report example
Turning Insights Into Better Events and Stronger Follow-Up
When reporting is clear, teams can:
- Adjust content based on topics that held attention or prompted questions
- Improve pacing with real viewing patterns and drop-off patterns from live and on-demand attendance
- Shape follow-up based on an attendee's expressed interest
- Share event impact with leadership confidently
- Build repeatable Teams webinar and Town Hall events with data-informed decisions
Teams events become far more effective when organizers understand what participants value most.
FAQ: Microsoft Teams Webinar and Town Hall Reporting
What reporting does Microsoft Teams provide for webinars?
Teams offers registration reports, attendance reports, simple poll results, Q&A exports, and access to recording and transcript files. These confirm who joined, how long they stayed connected, and how they engaged with basic features. They do not show slide views, resource downloads, or deeper engagement patterns.
What reports are included with Teams Town Halls?
Town Halls include a post-event attendance report, Q&A exports, an organizer summary, and the event recording. On advanced event licenses, organizers also get real-time insights (total viewers, peak concurrency, median session duration, and top regions) for events up to 3,000 attendees. While these reports do help confirm participation at scale, they do not provide individual engagement insights or intent signals.
How do I download a Teams Town Hall attendance report?
Open the past Town Hall in your Teams calendar, open its details, select Reports, choose the date and time of the event, and select Download. The report includes attendee count, event duration, average attendance time, attendee roles, and join and leave times.
How long are Teams Webinar and Town Hall Q&A reports available?
The Q&A report for a Webinar or Town Hall covers only the previous 28 days. Older posts stay in the Q&A feed but drop out of the export, so download the CSV within four weeks of the event.
Can I measure on-demand viewing in Teams?
Teams admins can see a Recording Views count per event in the Teams events usage report, but Teams does not show detailed viewing behavior. For programs where on-demand attendance matters, use a platform that tracks segment-level viewing and resource engagement.
Do Teams Webinar and Town Hall reports require Teams Premium?
No. Attendance reports are a foundational event feature, available on every Teams events license, including Business, Frontline, and Essentials plans. Real-time Town Hall insights are an advanced feature included with Microsoft 365 Business and and Frontline plans and Enterprise licenses (Office 365 E1, E3, and E5; Microsoft 356 E3, E5, and E7.) Teams Premium matters in two cases: presenters need it to appear in presenter analytics, and Premium bought before April 1, 2026 keeps insights for events up to 100,000 attendees until it expires.
Who can download Teams Town Hall reports?
The organizer downloads the Town Hall attendance report from the event’s Reports tab after it ends. Organizers and co-organizers can open real-time event insights and export any chart as a CSV for up to 28 days after the Town Hall starts. The organizer can also share the insights link with IT admins who hold roles such as Teams admin, Global reader, or Reports reader.
How do you add live polling data to a post-event ROI report?
Turn on respondent names before the event, export poll results from the Polls tab afterward, and match respondents to your registrant list. Report poll participation as respondents divided by unique attendees, next to the outcome each poll was written to test.
How can I qualify leads from a Teams Webinar?
Native reports offer limited information for qualification. You can see attendance and basic interaction, but you cannot track more granular insights. EventBuilder custom reporting adds attendee-level interaction detail, and Teams Webinars also connect to supported third-party marketing automation tools through Manage event, then Integrations.
Recommended Next Steps
If you want to deepen your reporting and understand real engagement, consider taking these steps:
- Audit your current reports
- Pull the last one or two Teams events.
- List the questions you can answer with your current reports.
- Highlight where you need to guess, such as content performance or intent.
- Confirm your attendance report policy with your Teams admin, and set a 28-day export reminder for every event.
- Decide what "engaged" means for your organization
- Common signals include poll participation, Q&A activity, post-event survey responses, and resource downloads.
- Define your engagement signals.
- Use EventBuilder to close any gaps
- Add custom reporting, designed in collaboration with our event program management experts, to help keep your existing meeting tools while dramatically upgrading your analytics.
Our event experts are ready to help Teams users make the most of their events! Get the insights that support better decisions, stronger follow-up, and clear results. Talk to EventBuilder about advanced Teams analytics today!

Struggling to Prove the ROI of Your Large-Scale Microsoft Teams Events?
Without a clear ROI, future budget and stakeholder support get harder to win, and the value your event created goes unclaimed.
Our comprehensive whitepaper, "Everything You Need to Know to Run Large Virtual Events Using Microsoft Teams," reveals the exact strategies and analytics pros use to run high-impact webinars, Town Halls, and hybrid events that deliver measurable results.
Inside, you'll learn:
- How to define and track success metrics that matter
- Advanced analytics techniques for post-event insight
- Proven methods to demonstrate ROI and win stakeholder support
- Speaker management tactics to keep audiences engaged from start to finish.
Don't let another event go unmeasured. Download the guide and start proving your event's value today.
Disclaimer: This article was created with some help from AI, but thoroughly edited, revised, reviewed, and fact-checked by a living, breathing, coffee-drinking human writer.
How to Prepare Large-Scale Events in Microsoft Teams and Town Hall

Microsoft Teams Meeting Types Explained
No Comments Yet
Let us know what you think